2024
Newport / PLANSPONSOR NQDC Plan Trends Survey

Industry Snapshot
Trend Watch
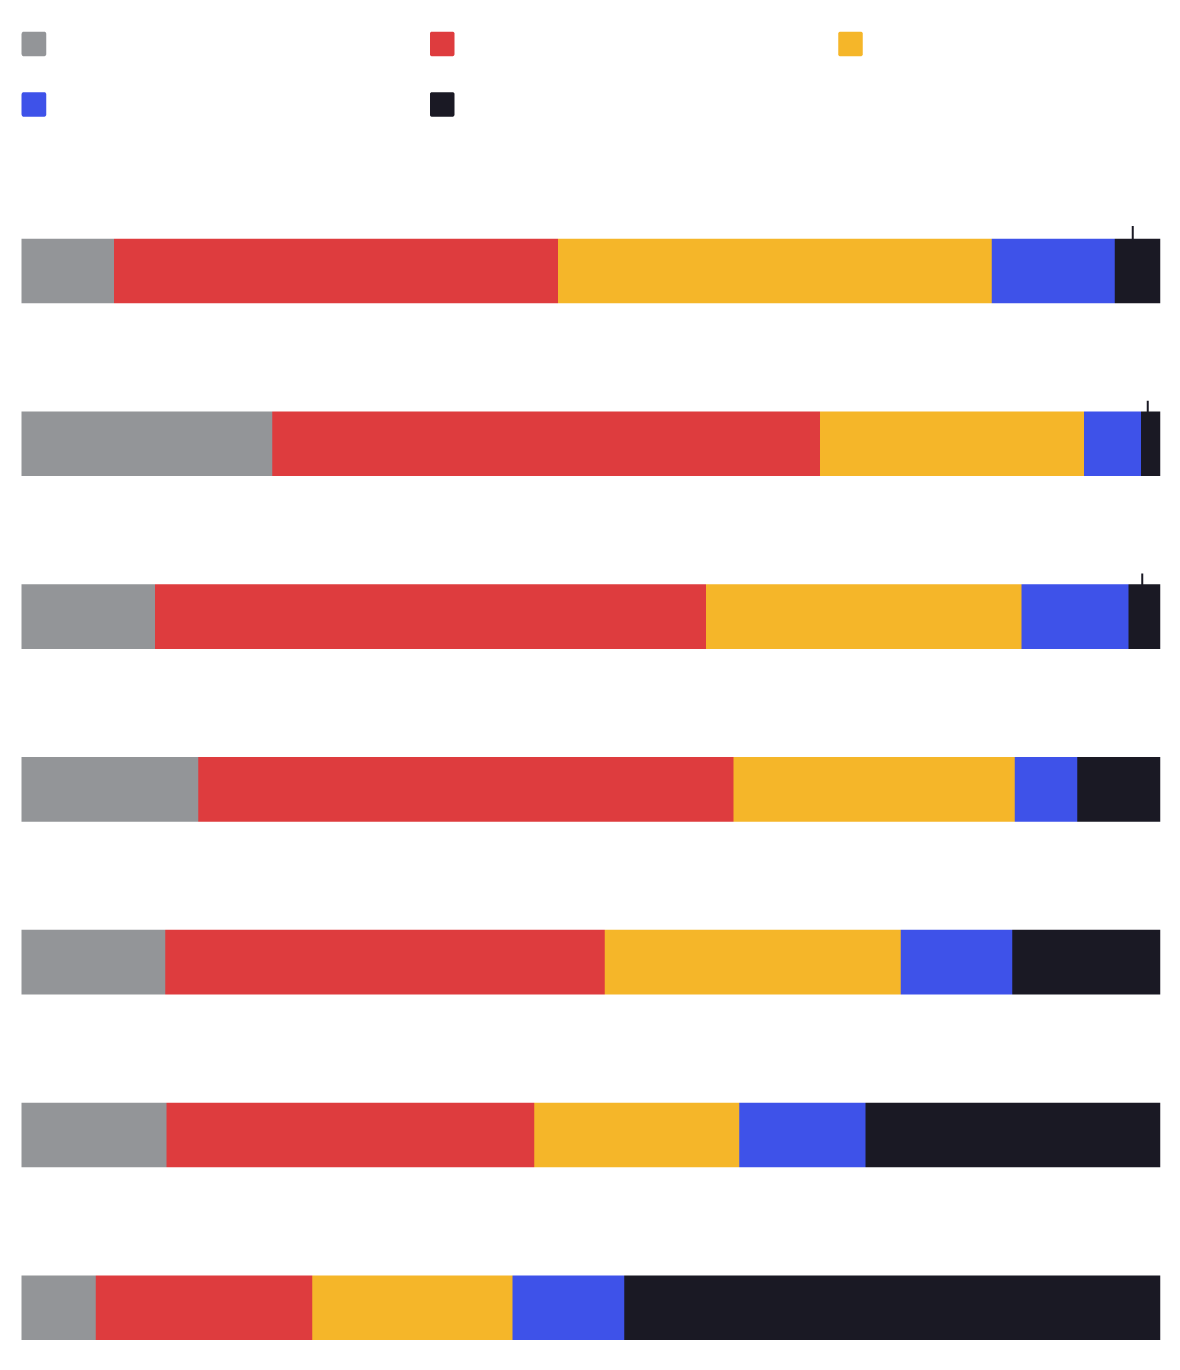
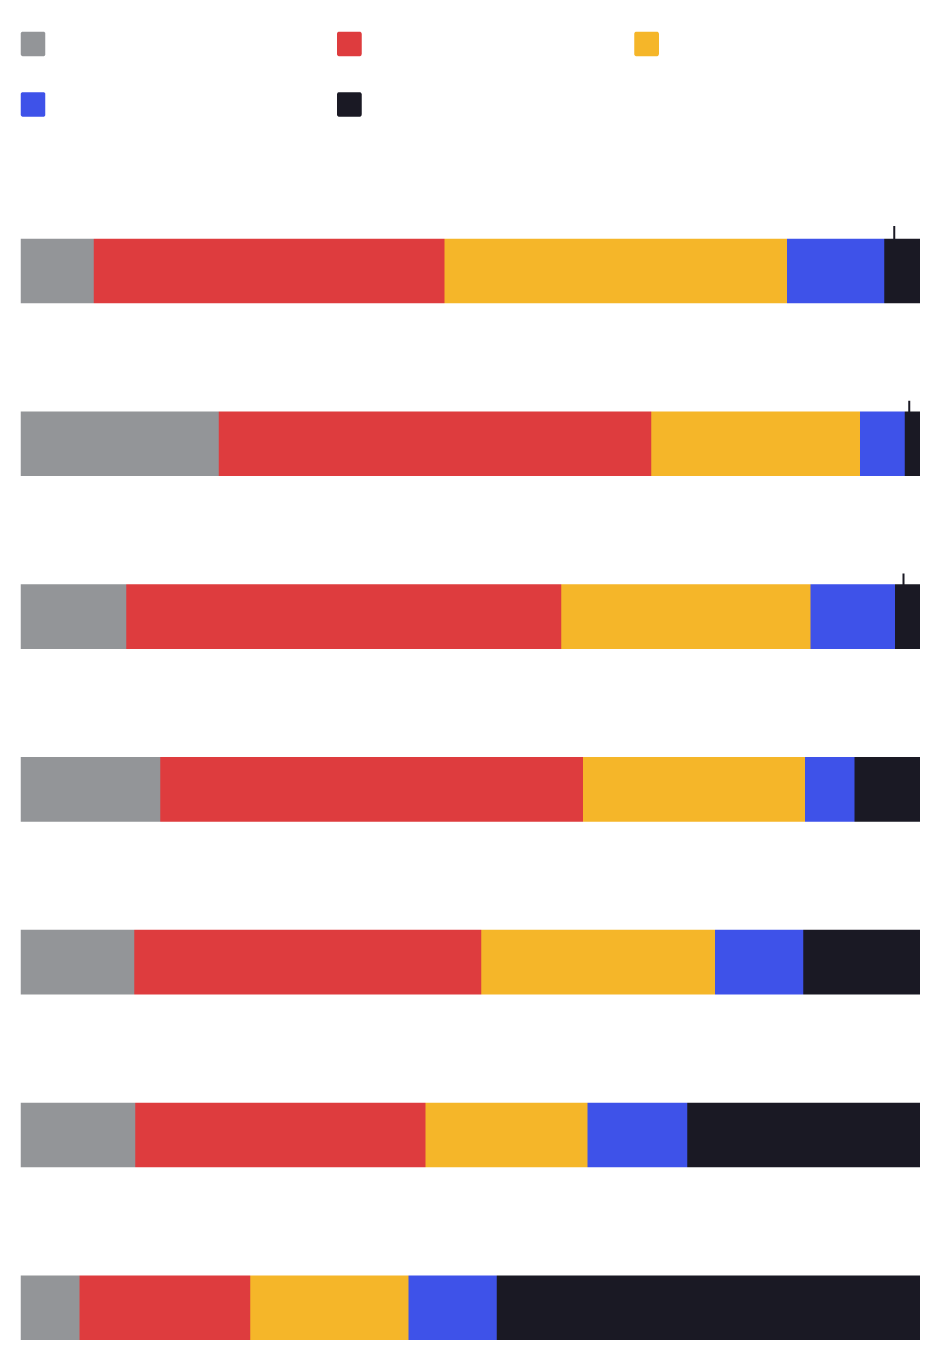
Effectiveness of Plan in Accomplishing Previously Ranked Goals
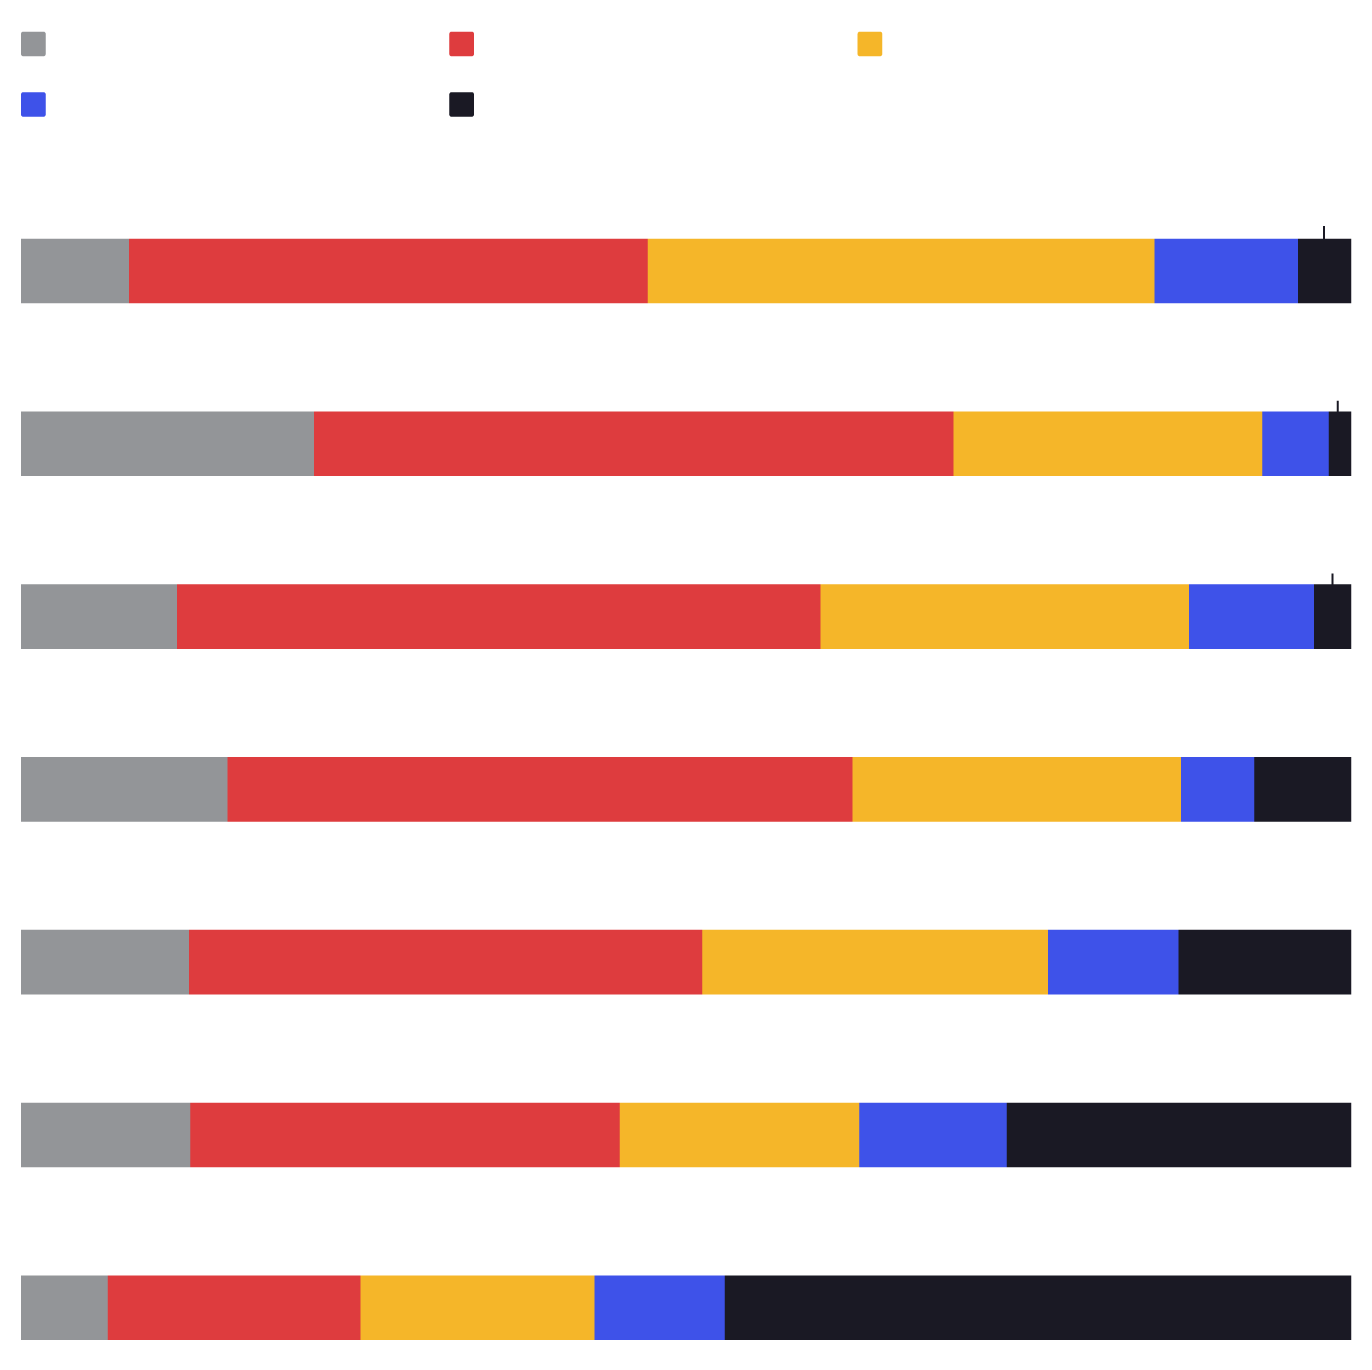
Extremely effective
Very effective
Moderately effective
Slightly effective
Not effective at all
Retain and attract executives
4.0%
8.1%
39.0%
38.1%
10.8%
Executive retirement savings
1.7%
22.0%
48.1%
23.2%
5.0%
Be competitive with peers
2.8%
11.7%
48.4%
27.7%
9.4%
Tax-efficient executive comp
15.5%
47.0%
24.7%
5.5%
7.3%
Executive savings for in-service payments
12.6%
38.6%
26.0%
9.8%
13.0%
Company contributions to specific employees
12.7%
32.3%
18.0%
11.1%
25.9%
Increase stock/equity ownership
6.5%
19.0%
17.6%
9.8%
47.1%
Changes Considered for Next 12 – 18 months
122 companies considering at least one change
| Improve participant communication/education | 72.1% |
| Provide better online tools | 32.8% |
| Review and enhance investment menu | 32.0% |
| Move plan administration to another provider | 24.6% |
| Add financial counseling/wellness services | 19.7% |
| Improve company match features | 9.0% |
| Improve distribution options/flexibility | 9.0% |
| Include other sources of compensation | 4.1% |
| Add an auto-enrollment feature | 3.3% |
| Other | 9.0% |
For full research findings with commentary from Newport, visit this site.